Figures from Our World in Data, show that Australia had annual CO2 emissions of 411,015,667 tonnes in 2019, this was an increase from 407,463,328 tonnes in 2009.
The figures are obviously highly related to population, and are therefore often quoted as Carbon Emissions per capita, (or per person).
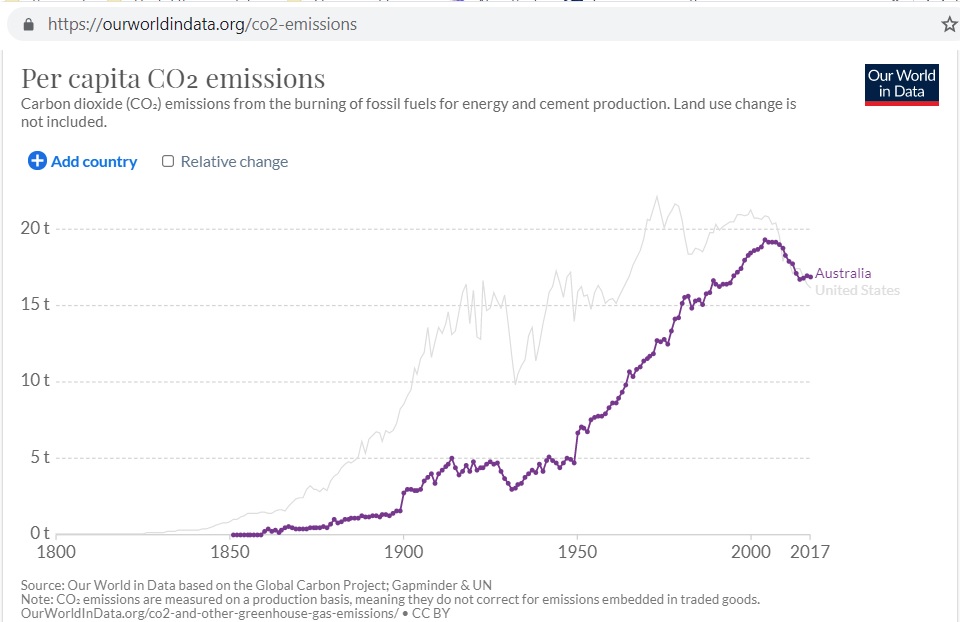
The change in Australian per capita CO2 emissions between 2009 and 2019 were a reduction from 18.73 to 16.31 tonnes per capita.
To compare these changes to some other parts of the world, we see that Australia is similar to the European Union and the United States. Much better than Europe as a whole, but behind the UK.
Per capita CO2 emissions change over the 10 years: 2009 to 2019
- 30.38% reduction in United Kingdom
- 13.94% reduction in EU-27
- 12.94% reduction in Australia
- 10.41% reduction in United States
- 4.13% reduction in Canada
- 2.45% reduction in Europe (excl. EU-27)
- 3.20% increase in World average
- 3.15% increase in Poland
- 7.87% increase in Russia
- 21.78% increase in Indonesia
- 24.50% increase in China
- 25.37% increase in Iran
- 44.60% increase in India
- 57.67% increase in Iraq
- 61.21% increase in Philippines
Source: ourworldindata.org/co2-emissions
A comparison of per capita CO2 emissions in similar evolving countries.
United States was at 3.0 tonnes per capita in 1874.
Australia was 3.0 tonnes in 1901.
The two countries have appeared to track each other in a similar way, but 25 years apart since then. Australia starting of at a less developed stage than the US, in some ways.
100 years later:
United States was 21.15 tonnes in 1974.
Australia was 18.63 tonnes in 2001.
10 years after that:
United States was 18.75 tonnes in 1984.
Australia was 17.93 tonnes in 2011.
another 8 years later:
United States was 19.95 tonnes in 1992.
Australia was 16.31 tonnes in 2019.
27 years after that
United States was 16.05 tonnes in 2019.
Australia could be 14.14? tonnes in 2046.
That figure of 14.14 is only if it follows the reductions obtained by the US, from that same 100 years period after they were at a similar stage at 3 tonnes each.
The figure of 14.14 for Australia, and 16.05 for USA, is 75.88% of the figure 45 years before.