Australian Unemployment Rates: August 1978 to 2015.
Unemployment Figures are released every month for Australia by the ABS, but what EXACTLY does the most commonly produced figure tell us?
The August 2015 Unemployment Rate is quoted by most publications as: 6.2%.
This is based on the ABS media report stating:
Australia’s estimated seasonally adjusted unemployment rate for August 2015 was 6.2 per cent, a decrease of 0.1 percentage points.
Full ABS Details for August 2015:
Unemployment rate ; Persons ; Percent ; Seasonally Adjusted 6.2%
The full figure according to ABS publications is 6.2204232%
However, they also publish these figures:
Unemployment rate ; Persons ; Percent ; Original: 6.1105291%
Unemployment rate ; Persons ; Percent ; Trend: 6.112268%
But, how RELEVANT are these figures to you ?
Are you Male, or Female?
Are you wanting Full Time Work or Part Time ?
There are different Unemployment Rates for each of these Groups too.
Unemployment rate ; Seasonally Adjusted; August 2015
Males: 6.1511045%
Females: 6.301628%
Unemployment rate looked for full-time work ; Seasonally Adjusted; August 2015
Males: 5.9069354%
Females: 7.4119088%
So, more relevant Australian unemployment figures may be:
5.9% Male Unemployment rate looked for full-time work in August 2015
7.4% Female Unemployment rate looked for full-time work in August 2015
Charts:
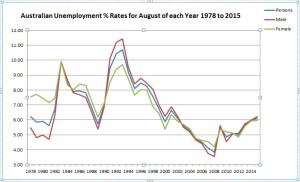
Australian Unemployment Rates for August of each Year 1978 to 2015.
Australian Unemployment Full Time Rates for August of each Year 1978 to 2015.
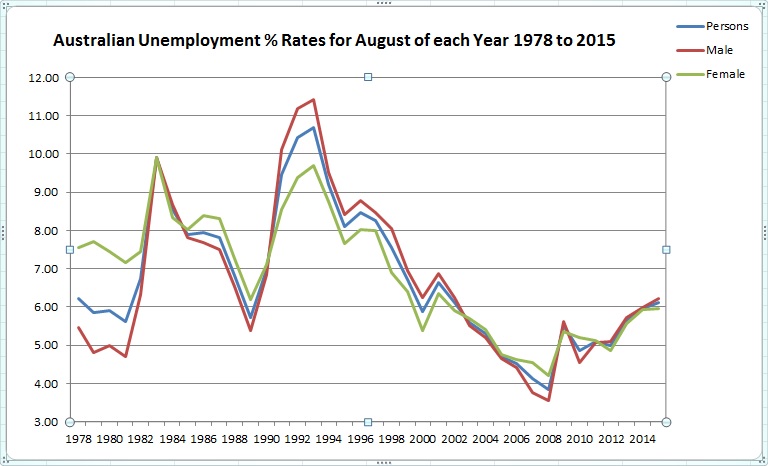
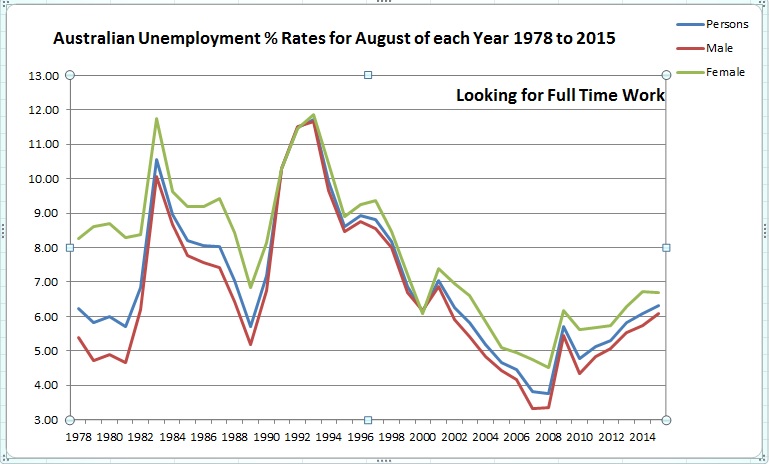
The above charts are based on the Original figures, and not seasonally adjusted, as they are for the same month each year; August.
A Comparison of Australians Not In The Labour Force in 1978 and 2015.
Persons Not In The Labour Force:.
In 2015 35.48% of people age 15 and over were not in the Labour Force
In 1978 39.42% of people age 15 and over were not in the Labour Force
A larger portion of the population is now working in 2015, 64.52% compared to 60.58% in 1978
This is an INCREASE of 6.50% from the 1978 figure.
Males Not In The Labour Force:.
In 2015 29.47% of Males age 15 and over were not in the Labour Force
In 1978 21.83% of Males age 15 and over were not in the Labour Force
A smaller portion of the MALE population is now working in 2015, 70.53% compared to 78.17% in 1978
This is an DECREASE of 9.77% from the 1978 figure.
Females Not In The Labour Force:.
In 2015 41.32% of Females age 15 and over were not in the Labour Force
In 1978 56.52% of Females age 15 and over were not in the Labour Force
A larger portion of the FEMALE population is now working in 2015, 58.68% compared to 43.48% in 1978
This is an INCREASE of 34.94% from the 1978 figure.
The above figures has been obtained from data released by the Australian Bureau of Statistics [ABS] 6202.0 Labour Force, Australia
Figures are based on the civilian population aged 15 years and over.