Migration Agent Statistics October to December 2012.
The Migration website www.border.gov.au www.homeaffairs.gov.au produces various statistics, and one page shows the ratio of Visa Applications processed via Registered Migration Agents.
In January 2016, the latest data is shown as being Migration Agent Statistics October – December 2012.
The full document is at: www.homeaffairs.gov.au PDF
Some excerpts are:
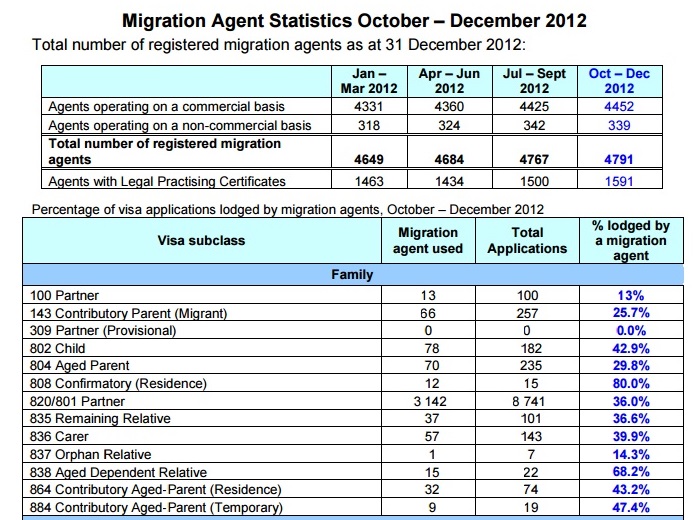
4,791 Total number of registered migration agents
4,452 Agents operating on a commercial basis
Percentage of visa applications lodged by migration agents, October to December 2012.
820/801 Partner Visa
8,741 Total Applications
3,142 or 36.0% lodged via Migration Agent
100 Partner Visa
100 Total Applications
13 or 13% lodged via Migration Agent
676 Tourist Visa
5,420 Total Applications
336 or 6.2% lodged via Migration Agent
Summary of Visa Types and percentage of Visas lodged by a Migration Agent.
Percentage lodged by Migration Agent by subclass :
Family Visa
13.0% : 100 Partner 13 out of 100 total visas lodged
25.7% : 143 Contributory Parent (Migrant) 66 out of 257 total visas lodged
0.0% : 309 Partner (Provisional) 0 out of 0 total visas lodged
42.9% : 802 Child 78 out of 182 total visas lodged
29.8% : 804 Aged Parent 70 out of 235 total visas lodged
80.0% : 808 Confirmatory (Residence) 12 out of 15 total visas lodged
36.0% : 820/801 801 Partner 3142 out of 8741 total visas lodged
36.6% : 835 Remaining Relative 37 out of 101 total visas lodged
39.9% : 836 Carer 57 out of 143 total visas lodged
14.3% : 837 Orphan Relative 1 out of 7 total visas lodged
68.2% : 838 Aged Dependent Relative 15 out of 22 total visas lodged
43.2% : 864 Contributory Aged-Parent (Residence) 32 out of 74 total visas lodged
47.4% : 884 Contributory Aged-Parent (Temporary) 9 out of 19 total visas lodged
Employer sponsored Visa
0.0% : 119 Regional Sponsored Migration Scheme 0 out of 7 total visas lodged
0.0% : 120 Labour Agreement 0 out of 0 total visas lodged
33.3% : 121 Employer Nomination 1 out of 3 total visas lodged
41.7% : 124 Distinguished Talent 15 out of 36 total visas lodged
0.0% : 855 Labour Agreement 0 out of 1 total visas lodged
9.4% : 856 Employer Nomination Scheme 3 out of 32 total visas lodged
0.0% : 857 Regional Sponsored Migration Scheme 0 out of 10 total visas lodged
82.8% : 858 Distinguished Talent 24 out of 29 total visas lodged
General skilled Visa
14.5% : 461 New Zealand Citizen Family Relationship (Temporary) 59 out of 407 total visas lodged
62.3% : 487 Skilled – Regional Sponsored 152 out of 244 total visas lodged
67.1% : 487 Skilled – Regional Sponsored 218 out of 325 total visas lodged
56.9% : 885 Skilled – Independent 2221 out of 3900 total visas lodged
51.9% : 885 Skilled – Independent 164 out of 316 total visas lodged
59.3% : 886 Skilled – Sponsored 213 out of 359 total visas lodged
58.8% : 886 Skilled – Sponsored 40 out of 68 total visas lodged
31.4% : 887 Skilled – Regional 199 out of 633 total visas lodged
42.1% : 887 Skilled – Regional 61 out of 145 total visas lodged
24.4% : 189 Skilled – Independent 2180 out of 8936 total visas lodged
40.9% : 190 Skilled – Nominated 1704 out of 4166 total visas lodged
Business skills Visa
86.2% : 890 Business Owner 112 out of 130 total visas lodged
100.0% : 891 Investor 5 out of 5 total visas lodged
89.0% : 892 State/Territory Sponsored Business Owner 942 out of 1059 total visas lodged
71.4% : 893 State/Territory Sponsored Business Investor 75 out of 105 total visas lodged
86.2% : 890 Business Owner 112 out of 130 total visas lodged
Student Visa
6.7% : 570 Independent ELICOS Sector 269 out of 4030 total visas lodged
21.0% : 570 Independent ELICOS Sector 161 out of 765 total visas lodged
8.9% : 571 Schools Sector 85 out of 950 total visas lodged
26.5% : 571 Schools Sector 117 out of 442 total visas lodged
23.2% : 572 Vocational Education and Training Sector 2134 out of 9205 total visas lodged
28.8% : 572 Vocational Education and Training Sector 985 out of 3420 total visas lodged
10.5% : 573 Higher Education Sector 1570 out of 14954 total visas lodged
18.2% : 573 Higher Education Sector 800 out of 4395 total visas lodged
1.8% : 574 Postgraduate Research Sector 16 out of 877 total visas lodged
3.6% : 574 Postgraduate Research Sector 19 out of 523 total visas lodged
0.4% : 575 Non-Award Sector 21 out of 4699 total visas lodged
6.2% : 575 Non-Award Sector 4 out of 65 total visas lodged
0.0% : 576 AusAID or Defence Sponsored 0 out of 188 total visas lodged
31.5% : 580 Student Guardian 53 out of 168 total visas lodged
6.7% : 570 Independent ELICOS Sector 269 out of 4030 total visas lodged
21.0% : 570 Independent ELICOS Sector 161 out of 765 total visas lodged
Visitor Visa
0.0% : 417 Working Holiday 1 out of 68789 total visas lodged
1.6% : 417 Working Holiday 7 out of 449 total visas lodged
75.0% : 459 Sponsored Business Visitor (Short Stay) 30 out of 40 total visas lodged
0.0% : 462 Work and Holiday 0 out of 1652 total visas lodged
3.4% : 488 Superyacht Crew 2 out of 59 total visas lodged
0.0% : 488 Superyacht Crew 0 out of 10 total visas lodged
6.1% : 675 Medical Treatment (Short Stay) 2 out of 33 total visas lodged
0.0% : 676 Tourist 1 out of 31462 total visas lodged
6.2% : 676 Tourist 336 out of 5420 total visas lodged
11.0% : 679 Sponsored Family Visitor 1032 out of 9397 total visas lodged
13.0% : 685 Medical Treatment (Long Stay) 31 out of 238 total visas lodged
Temporary Visa
2.1% : 476 Skilled – Graduate 5 out of 240 total visas lodged
11.1% : 476 Skilled – Graduate 2 out of 18 total visas lodged
50.7% : 485 Skilled – Graduate 3524 out of 6951 total visas lodged
50.8% : 485 Skilled – Graduate 621 out of 1223 total visas lodged
22.4% : 401 Temporary Work (Long Stay Activity) 32 out of 143 total visas lodged
7.9% : 402 Training and Research 19 out of 242 total visas lodged
0.0% : 403 Temporary Work (International Relations) 0 out of 41 total visas lodged
52.0% : 405 Investor Retirement 13 out of 25 total visas lodged
5.3% : 406 Government Agreement 1 out of 19 total visas lodged
10.1% : 410 Retirement 18 out of 179 total visas lodged
30.0% : 411 Exchange 3 out of 10 total visas lodged
0.0% : 415 Foreign Government Agency 0 out of 7 total visas lodged
12.3% : 416 Special Program 130 out of 1057 total visas lodged
1.8% : 419 Visiting Academic 1 out of 55 total visas lodged
2.9% : 420 Temporary Work (Entertainment) 171 out of 5844 total visas lodged
13.4% : 421 Sport 9 out of 67 total visas lodged
18.2% : 423 Media And Film Staff 2 out of 11 total visas lodged
0.0% : 426 Domestic Worker (Temporary) 0 out of 3 total visas lodged
33.3% : 427 Domestic Worker (Temporary) 1 out of 3 total visas lodged
24.6% : 428 Religious Worker 69 out of 280 total visas lodged
13.2% : 442 Occupational Trainee 116 out of 876 total visas lodged
0.0% : 444 Special Category 0 out of total visas lodged
68.2% : 457 Temporary Work (Skilled) 20506 out of 30047 total visas lodged
55.7% : 457 Temporary Work (Skilled) 1756 out of 3154 total visas lodged
0.0% : 470 Professional Development 0 out of 26 total visas lodged
0.0% : 995 Diplomatic (Temporary) 0 out of 307 total visas lodged
Bridging Visa
7.0% : 040 Bridging (Prospective Applicant) 17 out of 242 total visas lodged
0.0% : 041 Bridging (Non-Applicant) 0 out of 123 total visas lodged
10.2% : 050 Bridging (General) 1559 out of 15313 total visas lodged
20.0% : 060 Bridging F 1 out of 5 total visas lodged
This data shows a total of 264,478 visa application in the 3 months Oct-Dec 2012.
The Top FIVE largest numbers of applications being:.
68,789 417 Working Holiday
31,462 676 Tourist
30,047 457 Temporary Work (Skilled)
15,313 050 Bridging (General)
14,954 573 Higher Education Sector
Statistics on the migration advice industry, including the number of agents registered and the percentage of visa applications lodged by agents can be found at
Migration Agent Statistics October – December 2012 (62KB PDF)
Migration Agent Statistics July – September 2012 (45KB PDF)
Migration Agent Statistics April – June 2012 (62KB PDF)
Migration Agent Statistics January – March 2012 (49KB PDF)
For migration agent activity reports, refer to the Office of the MARA.
Donations Welcome | Thank you to those who have sent me a coffee, it is very much appreciated. Donations ai-8 |
Some Visa Applicants might find an Experienced Australian Migration Agent of great assistance. - ai16