Queensland First Home Buyers.
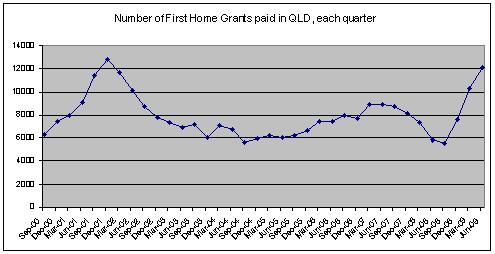
Number of First Home Buyer Grants issued in Queensland
- Jan-Mar 2010 5,816
- Oct-Dec 2009 8,235
- Jul-Sep 2009 10,231
- Apr ??Jun 2009 12,079
- Jan ??Mar 2009 10,334
- Oct ??Dec 2008 7,659
- Jul ??Sep 2008 5,523
The average for the previous three years, 2005 to 2007 was 7,816 grants per quarter (all at $7,000).
Out of 30,072 grants during Oct 2008 and Jun 2009:
- 3,183 got the full $21,000
- 21,797 got $14,000
- 5,092 received just the basic $7,000
This averaged out at $13,555 each.
This graph shows the numbers of basic Grants issued each quarter in Queensland.

Western Australia First Home Buyers.
In Western Australia, during the 2008-09 financial year, the number of loans issued to buy housing dropped by 11.7%, when compared to 2007-08.
- 2007-08 92,771
- 2008-09 81,875
However the numbers of First Home buyers, obtaining housing finance, increased by 26.4%
- 2007-08 16,445
- 2008-09 20,782
The figures for Non First Home buyers, showing a drop of20%, were:
- 2007-08 76,326
- 2008-09 61,093
An indication of the first two months of 2009-10 (July and August 2009 compared to July and August 2008) are:
- First Home Buyers – Up 56%
- Non First Home Buyers – Down 2%
New South Wales First Home Buyers.
In New South Wales, the number of First home buyers, purchasing a property with finance, changed over the last 13 months as follows:
Month : Number of dwellings financed : % of Total : Ave Mortgage size
- Sep-2008 2,977 = 20.58% $274,800
- Oct-2008 3,055 = 20.58% $283,300
- Nov-2008 3,895 = 25.09% $282,500
- Dec-2008 4,660 = 26.63% $282,500
- Jan-2009 3,732 = 26.97% $279,800
- Feb-2009 5,024 = 29.14% $292,300
- Mar-2009 6,317 = 30.11% $299,400
- Apr-2009 5,909 = 29.64% $299,400
- May-2009 6,394 = 30.15% $296,700
- Jun-2009 5,941 = 28.41% $282,300
- Jul-2009 5,449 = 25.88% $280,900
- Aug-2009 4,654 = 25.88% $283,600
- Sep-2009 5,236 = 26.69% $287,500
The NSW monthly average for last 13 months has been :
4,865 loans per month to First Home Buyers, or 26.90% of the total, with an average loan of $287,836 for each First Home financed.
Some interesting pieces of older information:.
During the period 1988-90 there were 290,000 first home buyers out of a total of 942,00 total Australian property purchases during that two years.
- 1988-90 30.7% were First Home Buyers Source PDF File
- 2007-09 26.3% were First Home Buyers in Australia Source – 5609.0 – Housing Finance, Australia
- 2007-09 21.3% were First Home Buyers in Western Australia
- 2007-09 28.3% were First Home Buyers in New South Wales
During the 1988-90 period the First Home buyer was aged between 25 and 34, and bought a 3 bedroom detached house with an undercover parking space.
The median price of Australian property in 1988-90 was about $85,000.
About 74% of First Home buyers had a household income exceeding $27,500.
34.8% of Australian households, during that time, had a Household income exceeding $42,500, whilst 43.8% of first home buyers exceeded that income.
Price range of property purchased in 1988-90
First Home Buyers
- 26.5% Under 62,500
- 23.3% $62,500 to $84,999
- 26.4% $85,000 to $119,999
- 23.8% Over $120,000
Non-First Home Buyers
- 11.8% Under 62,500
- 16.5% $62,500 to $84,999
- 28.9% $85,000 to $119,999
- 42.8% Over $120,000
First Home Owners in 1995, 1996, 2005 and 2006.
Number of First Home Buyers in Australia
- 1995-96 there were 318,200 First Home Buyers
- 2005-06 there were 303,300 First Home Buyers
1995-96
- 84.7% Detached House
- 7.9% Semi-detached, row, terrace or town house
- 7.4% Flat, unit or apartment
2005-06
- 72.3% Detached House
- 15.2% Semi-detached, row, terrace or town house
- 11.5% Flat, unit or apartment
Average Age of First Home Buyers in Australia
- 1995-96 32 years
- 2005-06 33 years
Sources:
