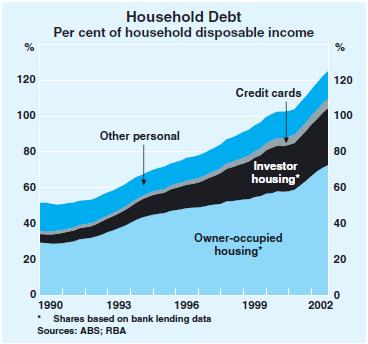
The ratio of Household Debt to Disposable income has more than tripled since the early 1990s, to around 160 per cent in 2008. source: www.treasury.gov.au
One possible cause of this is the increase in Property Ownership in Australia, especially with Investment Property ownership.
The Reserve Bank of Australia publishes monthly figures showing changes in Household Debt comparisons to Housing assets and to Disposable Income, together with other ratios. This information, in spreadsheet format is available at: source: www.rba.gov.au
The Australia Household Debt to Disposable income ratios for the last 10 years are:
- 156.1 Jun 2009
- 159.0 Jun 2008
- 158.3 Jun 2007
- 154.7 Jun 2006
- 148.5 Jun 2005
- 140.4 Jun 2004
- 127.0 Jun 2003
- 112.9 Jun 2002
- 99.0 Jun 2001
- 96.7 Jun 2000
- 88.8 Jun 1999
This shows an increase of almost 76% in the Household Debt to Disposable incomes figure over a ten year period.
During the preceding 10 years, Jun 1989 to Jun 1999 the ratio went from 48.2 to 88.8, an increase of just over 84%.
The 10 years prior to that though, was a ratio of 39.2 up to 48.2, an increase of only 23% over a ten year period.
An easy indication of how this “Household Debt to Disposable Income figure” is changing, in ten year periods is:
- 22.96% increase June 1979 to Jun 1989 (11% of Household Debt was Investment property)
- 84.20% increase June 1989 to Jun 1999 (25% of Household Debt was Investment property)
- 75.80% increase June 1999 to Jun 2009
Some breakdowns of this Household Debt are shown below.
Household Debt in Australia December 1990
- % Housing
- % ?? Owner-occupier
- 11% ?? Investor
- % Personal
- % ?? Credit cards
- % ?? Other
- Total 100%
Household Debt in Australia December 2002
- 83.5% Housing
- 58.1% ?? Owner-occupier
- 25.4% ?? Investor
- 16.5% Personal
- 4.2% ?? Credit cards
- 12.3% ?? Other
- Total 100%

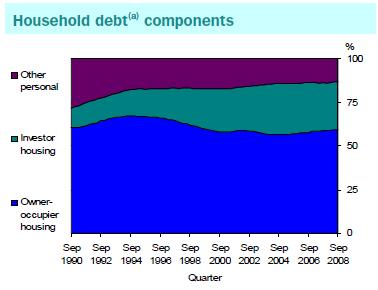
Household Debt in Australia December 2008
Housing debt as a proportion of disposable income made up 87% of all debt in December 2008. This is an increase from the 83.5% in 2002.
Between 1990 and 2008, debt for investor housing increased from 11% to 27% of all household debt. This is about a 250% increase in investment housing debt.
Household Debt for owner occupiers ranged from 56% to 67%.
Other personal debt (for example credit cards) halved as a proportion of all debt.

Household Debt in Australia 2005-2006
In 2005-2006 there were 5,723,400 households with debt of one form or another. This is about 81.5% of all the Australian Households at the time.
The median averages of each type of debt was:
- $130,800 Owner-occupied property (2,569,800)
- $202,000 Rental property (560,900)
- $138,000 Other property (389,200)
- $ 79,600 Investments (234,700)
- $ 2,300 Credit card (4,384,100)
- $ 14,000 Vehicle purchase (1,316,400)
- $ 9,000 Student debt (932,900)
- $ 7,000 Other purposes (789,800)
In 2005-06
- The median amount owed by indebted Australian households was $50,500,
- The median value of their assets was $488,000
- Their median disposable household income per year was $56,900.
Source: http://www.abs.gov.au/AUSSTATS/abs@.nsf/Lookup/4102.0Main+Features60March%202009
More to follow…
Household Debt PDF document from the Australian Bureau of Statistics – Australian Social Trends 2009
Household Debt in Australia July 2009
