The Real Cost of Electricity in Australia.
How much YOUR Electricity bill will be depends on many factors, including what part of Australia you are in, and more especially, how much electricity you CHOOSE to use, and whether you have a Solar panel system.
In March 2012, yes, 10 years ago, it was reported in the news that “Australian households are paying among the highest electricity prices in the developed world according to research commissioned by the nation’s top 100 power users“.
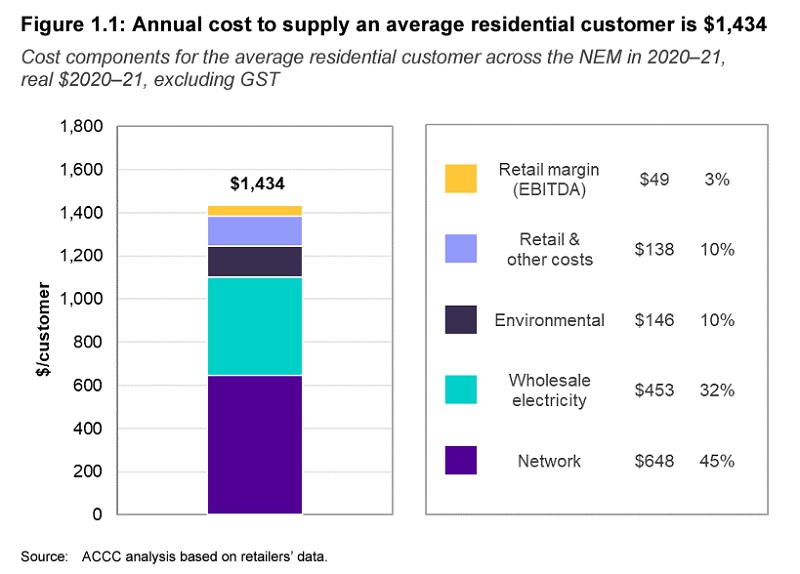
An ACCC Report (Inquiry into the National Electricity Market – November 2021 report) showed that the average annual cost of electricity per residential customer in 2020–21 was $1,434, down by 8% from the $1,562 in 2018–19.
In September 2021, a survey found that the average quarterly electricity bill in Australia was $412. About $1,648 per year. This varied between $1,360 per year in WA, and 1,860 per year in SA.
In December 2021, the AEMC (Australian Energy Market Commission) quoted the Australian average electricity bill as $1,645. This varied between $1,226 in South-East Queensland, and $2,004.00 in Tasmania and the Australia Capital Territory.
- $1,226 South-East Queensland (QLD)
- $1,253 New South Wales (NSW)
- $1,290 Victoria (VIC)
- $1,742 South Australia (SA)
- $1,992 Western Australia (WA)
- $2,004 Tasmania (TAS)
- $2,004 Australia Capital Territory (ACT)
Another survey, in February 2022, showed the following annual electricity costs:
- $1,168 Western Australia
- $1,172 Queensland
- $1,348 ACT
- $1,392 Victoria
- $1,424 New South Wales
- $1,488 South Australia
- $1,824 Tasmania
My Personal Experience with Electricity Bills.
Having Solar panels can make a large difference to what you end up paying. We have a small 3.5kWh system, paid back over 3 years by what we saved. We are in SE Queensland.
My bills, before the Solar contribution, would have averaged $1,467 per year, over the last three years. But they actually averaged $680 per year after taking the solar contribution into account.
My last 4 bills in 2017/18, before we installed Solar, cost us $1,449 for the 3,991 kW hours that we used. This worked out at $0.363 per kWh.
Preparing this page of information has made me realise that we increased our electricity usage by 25%, after getting solar panels installed. We now average about 5,000 kWh per year. It seems we became less restricted with our power usage, as some of it was now free.
These are my Electricity usage figures, each year for 3 years, showing actual kWh consumption for the year, the gross cost of Electricity usage and supply charges, the Solar panel contribution each year, and the net cost after solar buyback. Figures also show the cost per kWh of electricity consumed.
2019 Electricity Bills
5103.5 kWh consumed at $ 0.21 per kWh = $1,071.74
Supply Charge at $ 1.16 per day = $423.40
Total Bill without Solar: $1,495.14
(Supply and Usage Cost per kWh = $0.29)
But, actual figures with Solar Panels:
3131.7 kWh paid for at $ 0.21 per kWh = $657.66
1971.8 kWh free, from Solar panels $0.00
3807.2 kWh SOLD, from Solar panels at $ 0.11 per kWh = -$418.79 refund.
Supply Charge at $ 1.16 per day = $423.40
Actual Total Bill for the year: $662.27
(Supply and Usage Cost per kWh = $0.13)
2020 Electricity Bills
4903.3 kWh consumed at $ 0.21 per kWh = $1,029.69
Supply Charge at $ 1.16 per day = $423.40
Total Bill without Solar: $1,453.09
(Supply and Usage Cost per kWh = $0.30)
But, actual figures with Solar Panels:
3042 kWh paid for at $ 0.21 per kWh = $638.82
1861.3 kWh free, from Solar panels $0.00
3558.7 kWh SOLD, from Solar panels at $ 0.11 per kWh = -$391.46 refund.
Supply Charge at $ 1.16 per day = $423.40
Actual Total Bill for the year: $670.76
(Supply and Usage Cost per kWh = $0.14)
2021 Electricity Bills
4904.6 kWh consumed at $ 0.21 per kWh = $1,029.97
Supply Charge at $ 1.16 per day = $423.40
Total Bill without Solar: $1,453.37
(Supply and Usage Cost per kWh = $0.30)
But, actual figures with Solar Panels:
3097 kWh paid for at $ 0.21 per kWh = $650.37
1807.6 kWh free, from Solar panels $0.00
3344.4 kWh SOLD, from Solar panels at $ 0.11 per kWh = -$367.88 refund.
Supply Charge at $ 1.16 per day = $423.40
Actual Total Bill for the year: $705.89
(Supply and Usage Cost per kWh = $0.14)
Total Solar Panel saving over 3 years = $2,362.68
These are my usage figures detailed per month over 3 years, showing each months actual kWh usage, and the Solar panel contribution.
Electricity Usage for the year 2019.
- For the 31 days of January 2019, 515kWh of Solar Power was generated. Solar used as % of total consumed: 40.72%.
- For the 28 days of February 2019, 473kWh of Solar Power was generated. Solar used as % of total consumed: 40.85%.
- For the 31 days of March 2019, 443kWh of Solar Power was generated. Solar used as % of total consumed: 36.19%.
- For the 30 days of April 2019, 470kWh of Solar Power was generated. Solar used as % of total consumed: 40.7%.
- For the 31 days of May 2019, 431kWh of Solar Power was generated. Solar used as % of total consumed: 37.63%.
- For the 30 days of June 2019, 366kWh of Solar Power was generated. Solar used as % of total consumed: 34.59%.
- For the 31 days of July 2019, 447kWh of Solar Power was generated. Solar used as % of total consumed: 39.32%.
- For the 31 days of August 2019, 500kWh of Solar Power was generated. Solar used as % of total consumed: 42.41%.
- For the 30 days of September 2019, 554kWh of Solar Power was generated. Solar used as % of total consumed: 43.16%.
- For the 31 days of October 2019, 536kWh of Solar Power was generated. Solar used as % of total consumed: 40.33%.
- For the 30 days of November 2019, 523kWh of Solar Power was generated. Solar used as % of total consumed: 36.94%.
- For the 31 days of December 2019, 521kWh of Solar Power was generated. Solar used as % of total consumed: 34.78%.
Electricity Usage for the year 2020.
- For the 31 days of January 2020, 472kWh of Solar Power was generated. Solar used as % of total consumed: 35.09%.
- For the 29 days of February 2020, 397kWh of Solar Power was generated. Solar used as % of total consumed: 33.29%.
- For the 31 days of March 2020, 495kWh of Solar Power was generated. Solar used as % of total consumed: 37.01%.
- For the 30 days of April 2020, 453kWh of Solar Power was generated. Solar used as % of total consumed: 38.33%.
- For the 31 days of May 2020, 403kWh of Solar Power was generated. Solar used as % of total consumed: 34.03%.
- For the 30 days of June 2020, 390kWh of Solar Power was generated. Solar used as % of total consumed: 37.96%.
- For the 31 days of July 2020, 399kWh of Solar Power was generated. Solar used as % of total consumed: 32.33%.
- For the 31 days of August 2020, 506kWh of Solar Power was generated. Solar used as % of total consumed: 44.17%.
- For the 30 days of September 2020, 484kWh of Solar Power was generated. Solar used as % of total consumed: 45%.
- For the 31 days of October 2020, 481kWh of Solar Power was generated. Solar used as % of total consumed: 44.21%.
- For the 30 days of November 2020, 520kWh of Solar Power was generated. Solar used as % of total consumed: 41.43%.
- For the 31 days of December 2020, 420kWh of Solar Power was generated. Solar used as % of total consumed: 38.64%.
Electricity Usage for the year 2021.
- For the 31 days of January 2021, 448kWh of Solar Power was generated. Solar used as % of total consumed: 39.05%.
- For the 28 days of February 2021, 423kWh of Solar Power was generated. Solar used as % of total consumed: 41.27%.
- For the 31 days of March 2021, 402kWh of Solar Power was generated. Solar used as % of total consumed: 37.26%.
- For the 30 days of April 2021, 435kWh of Solar Power was generated. Solar used as % of total consumed: 40.45%.
- For the 31 days of May 2021, 420kWh of Solar Power was generated. Solar used as % of total consumed: 34.98%.
- For the 30 days of June 2021, 357kWh of Solar Power was generated. Solar used as % of total consumed: 25.75%.
- For the 31 days of July 2021, 375kWh of Solar Power was generated. Solar used as % of total consumed: 27.98%.
- For the 31 days of August 2021, 475kWh of Solar Power was generated. Solar used as % of total consumed: 37.92%.
- For the 30 days of September 2021, 469kWh of Solar Power was generated. Solar used as % of total consumed: 41.52%.
- For the 31 days of October 2021, 487kWh of Solar Power was generated. Solar used as % of total consumed: 44.59%.
- For the 30 days of November 2021, 393kWh of Solar Power was generated. Solar used as % of total consumed: 41.68%.
- For the 31 days of December 2021, 468kWh of Solar Power was generated. Solar used as % of total consumed: 43.17%.
